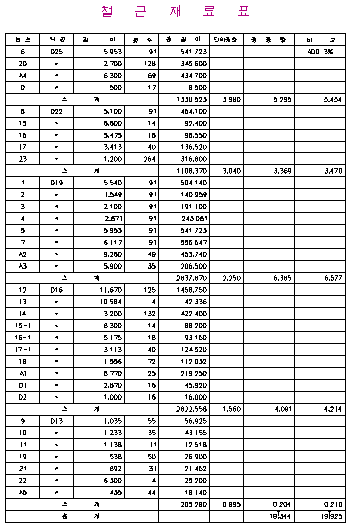
Г¶ұЩАз·бЗҘёҰ ёёөйҫоБЭҙПҙЩ.
Program name : HBLIST.LSP
Making rebar table is very simple. We can get amount of rebar weight by muliplying length to number of rebars. You can choose two method. One method is using data file, and anorther method is using text entities in the drawing. If you use this program, you have not to use calculater. Expecially, It is very easy to modify the table when length or number is changed.
ЎЯ This program has functions below ў№The data is separated by ','. Blank is ignored. ў№Lowercase text is converted to uppercase. ў№This program sorts list by rebar diameter ў№Unit of rebar length is mm. If length is shorter then 1m. It dosen't wirte 0.500 but 500 ў№You can determine scale factor. ў№Hight of one low if 7mm, Height of text is 2.5mm. (When drawing is printed)
ЎЯ Notice ў№This program use three blocks. You can modify these blocks. \BLOCKS\BHEAD.DWG is tile and header of table \BLOCKS\BGRDT.DWG is grand total \BLOCKS\BSUBT.DWG is sub total
Example-1 In the case using data file File/Entity <File>:
or f
[type enter or type enter after 'f' to use data file] e
[If you want to use text entities, Enter E option] Select data file on the dialog box insert point: [Pick insert point] scale factor: 50
[Enter scale of drawing(usualy same as DIMSCALE. In this case, enter 50. this drawing has 1:50 scale] data file і»ҝл
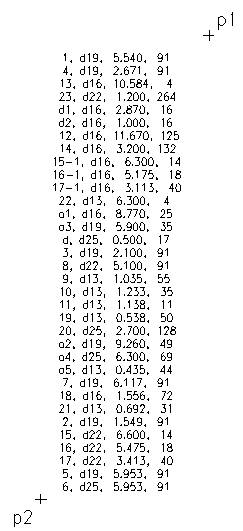
      1, d19,  5.540,  91
      4, d19,  2.671,  91
     13, d16, 10.584,   4
     23, d22,  1.200, 264
     d1, d16,  2.870,  16
     d2, d16,  1.000,  16
     12, d16, 11.670, 125
     14, d16,  3.200, 132
   15-1, d16,  6.300,  14
   16-1, d16,  5.175,  18
   17-1, d16,  3.113,  40
22, d13, 6.300, 4 |
   a1, d16,  8.770,  25
   a3, d19,  5.900,  35
    d, d25,  0.500,  17
    3, d19,  2.100,  91
    8, d22,  5.100,  91
    9, d13,  1.035,  55
   10, d13,  1.233,  35
   11, d13,  1.138,  11
   19, d13,  0.538,  50
   20, d25,  2.700, 128
   a2, d19,  9.260,  49
a4, d25, 6.300, 69 |
a5, d13, 0.435, 44 7, d19, 6.117, 91 18, d16, 1.556, 72 21, d13, 0.692, 31 2, d19, 1.549, 91 15, d22, 6.600, 14 16, d22, 5.475, 18 17, d22, 3.413, 40 5, d19, 5.953, 91 6, d25, 5.953, 91 |
ЎШ The three column table above is just for illustration. You need to create a data file with one column.Example-2 In the case using text entities File/Entity <File>: E
[Program get data from text entities in the drawing] select entity: {p} {p2} [Select text entities by using cross box] select entity:
[type Enter to finish selecting] insert point: [Pick insert point. (Upper left of table)] scale factor: 50
[Enter scale factor]
ЎШ You can give data by two method. File method is easy to modify. Entity method is easy to manage data, because drawing and data is one togeter in drawing.

